
Observation Charts & Vitals Trending
Track longitudinal vital signs, view Blood Pressure and Heart Rate trends, monitor BMI curves, and analyze diagnostic panels.
Medaius provides interactive clinical trend charts to track patient vital signs and laboratory observations across successive visits. Instead of searching through past paper notes, clinicians can instantly spot physiological trends, monitor chronic conditions, and assess treatment efficacy.
This guide explains how to access patient charts, filter by time intervals, analyze Blood Pressure and Heart Rate curves, and review multi-parameter laboratory panels.
Accessing Patient Charts
To view longitudinal charts for a patient:
- Open Patients in the sidebar and select a patient record (e.g., patient Alex Morgan or Sarah Chen).
- On the patient profile overview, click the Trend Charts quick action button, or append
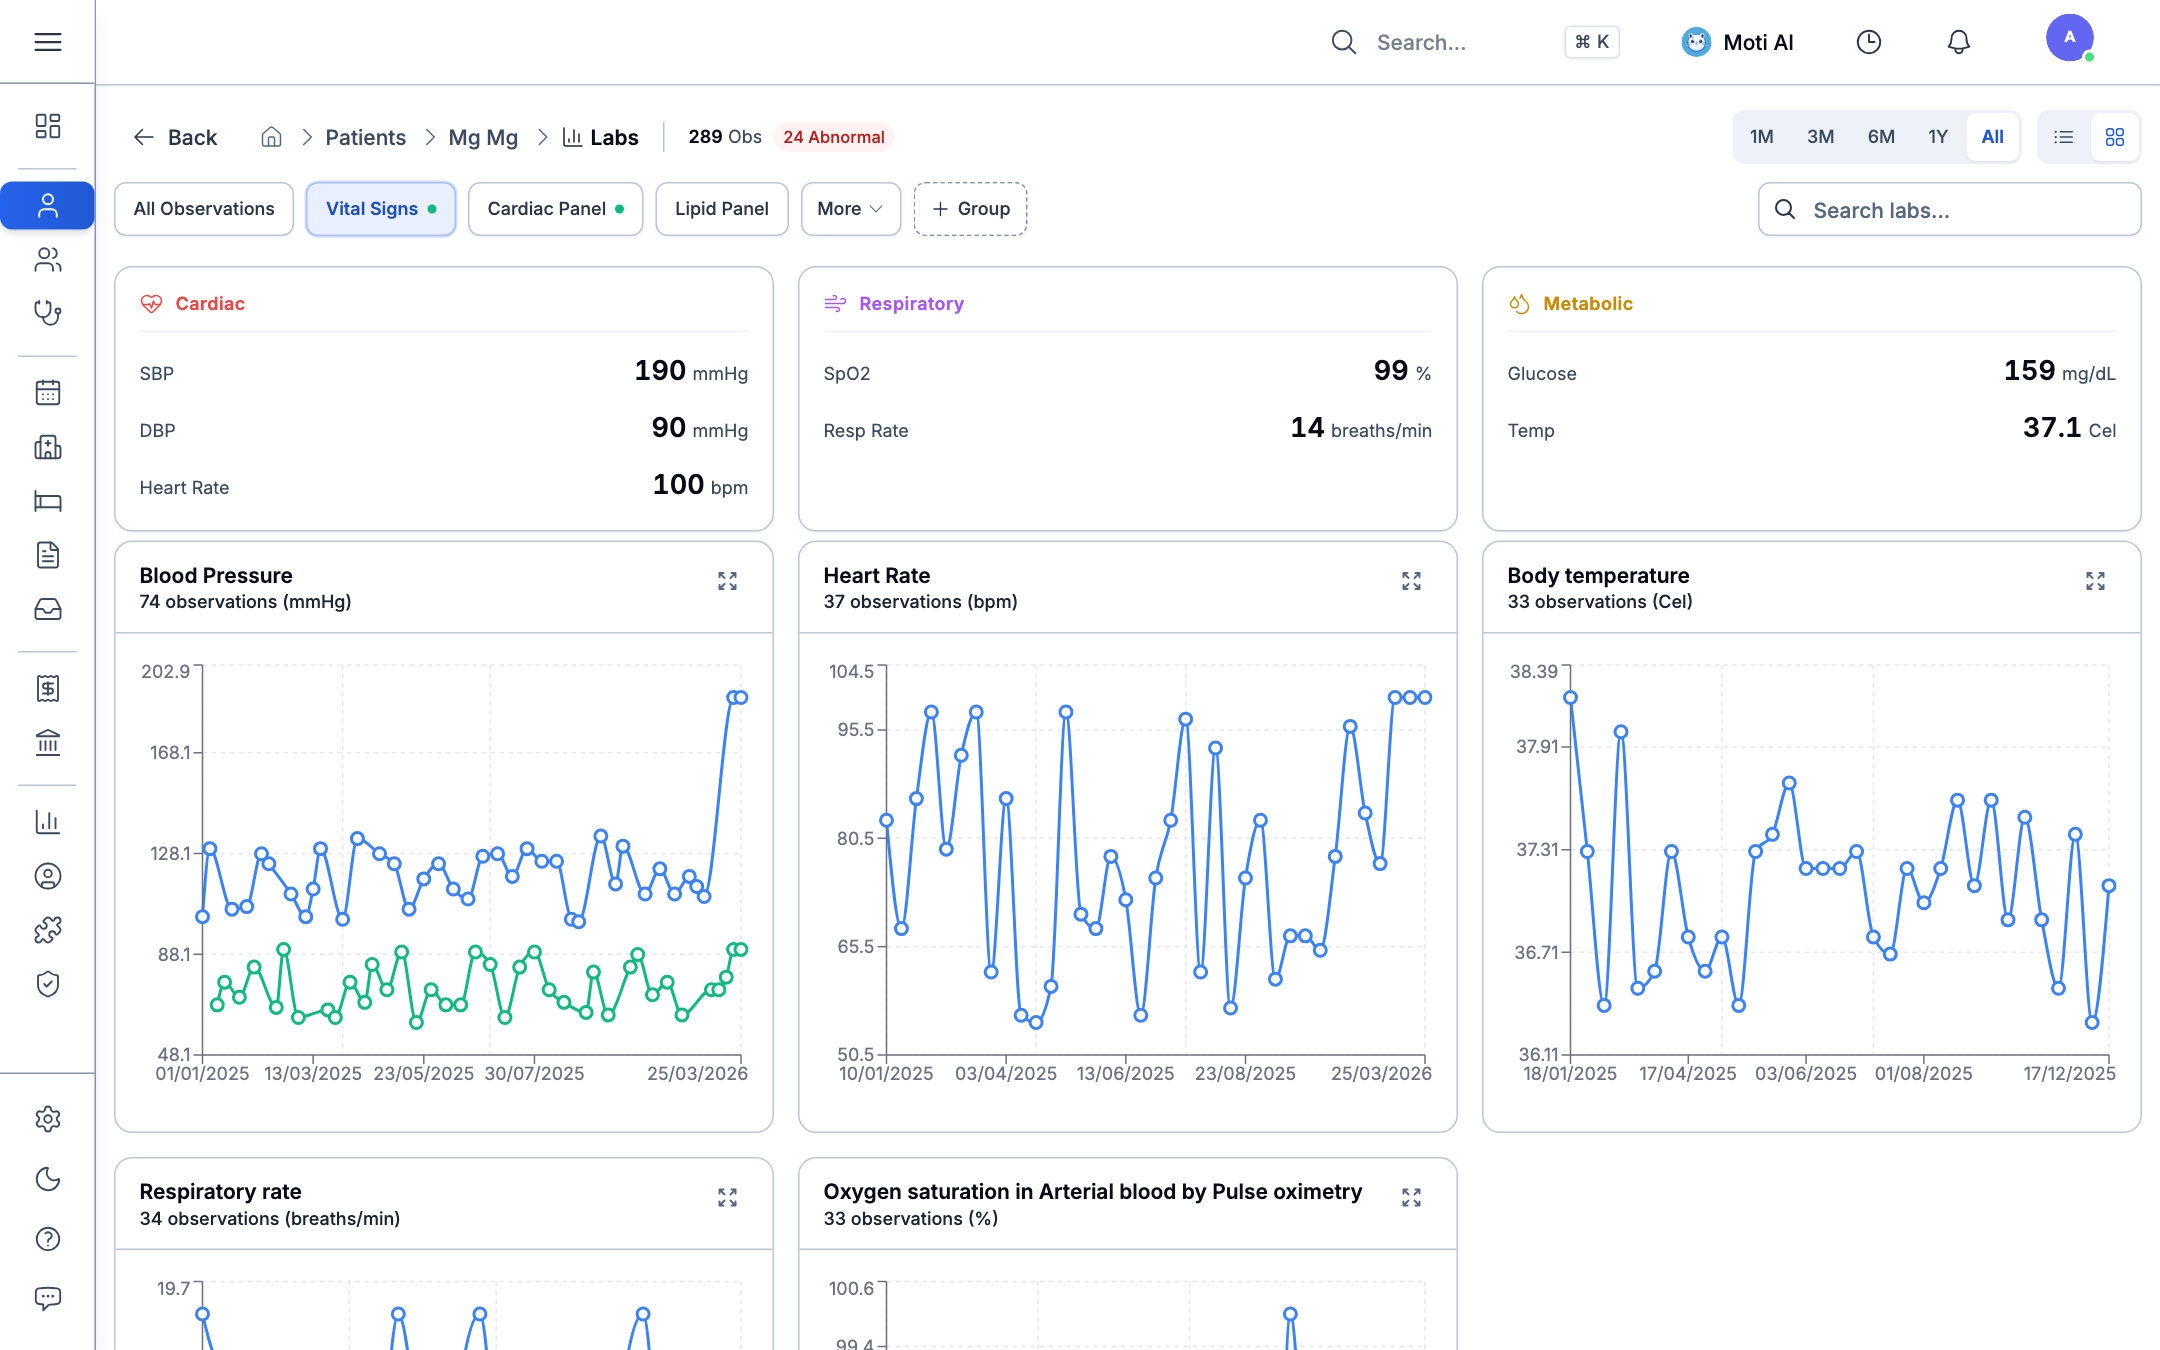
/chartsto the patient URL. - The comprehensive Longitudinal Charts Dashboard opens:
Interactive Time Presets
Clinicians can adjust the historical observation window using the time range buttons at the top:
1M(1 Month): Ideal for monitoring acute recovery, post-surgical follow-ups, or recent medication adjustments.3M(3 Months): Common interval for quarterly chronic disease checks (e.g., hypertension, diabetes).6M(6 Months): Semi-annual surveillance of long-term vital stability.1Y(1 Year): Annual health reviews and seasonal health patterns.All: Complete longitudinal health trajectory from the patient's very first visit to today.
Vital Signs Tracking
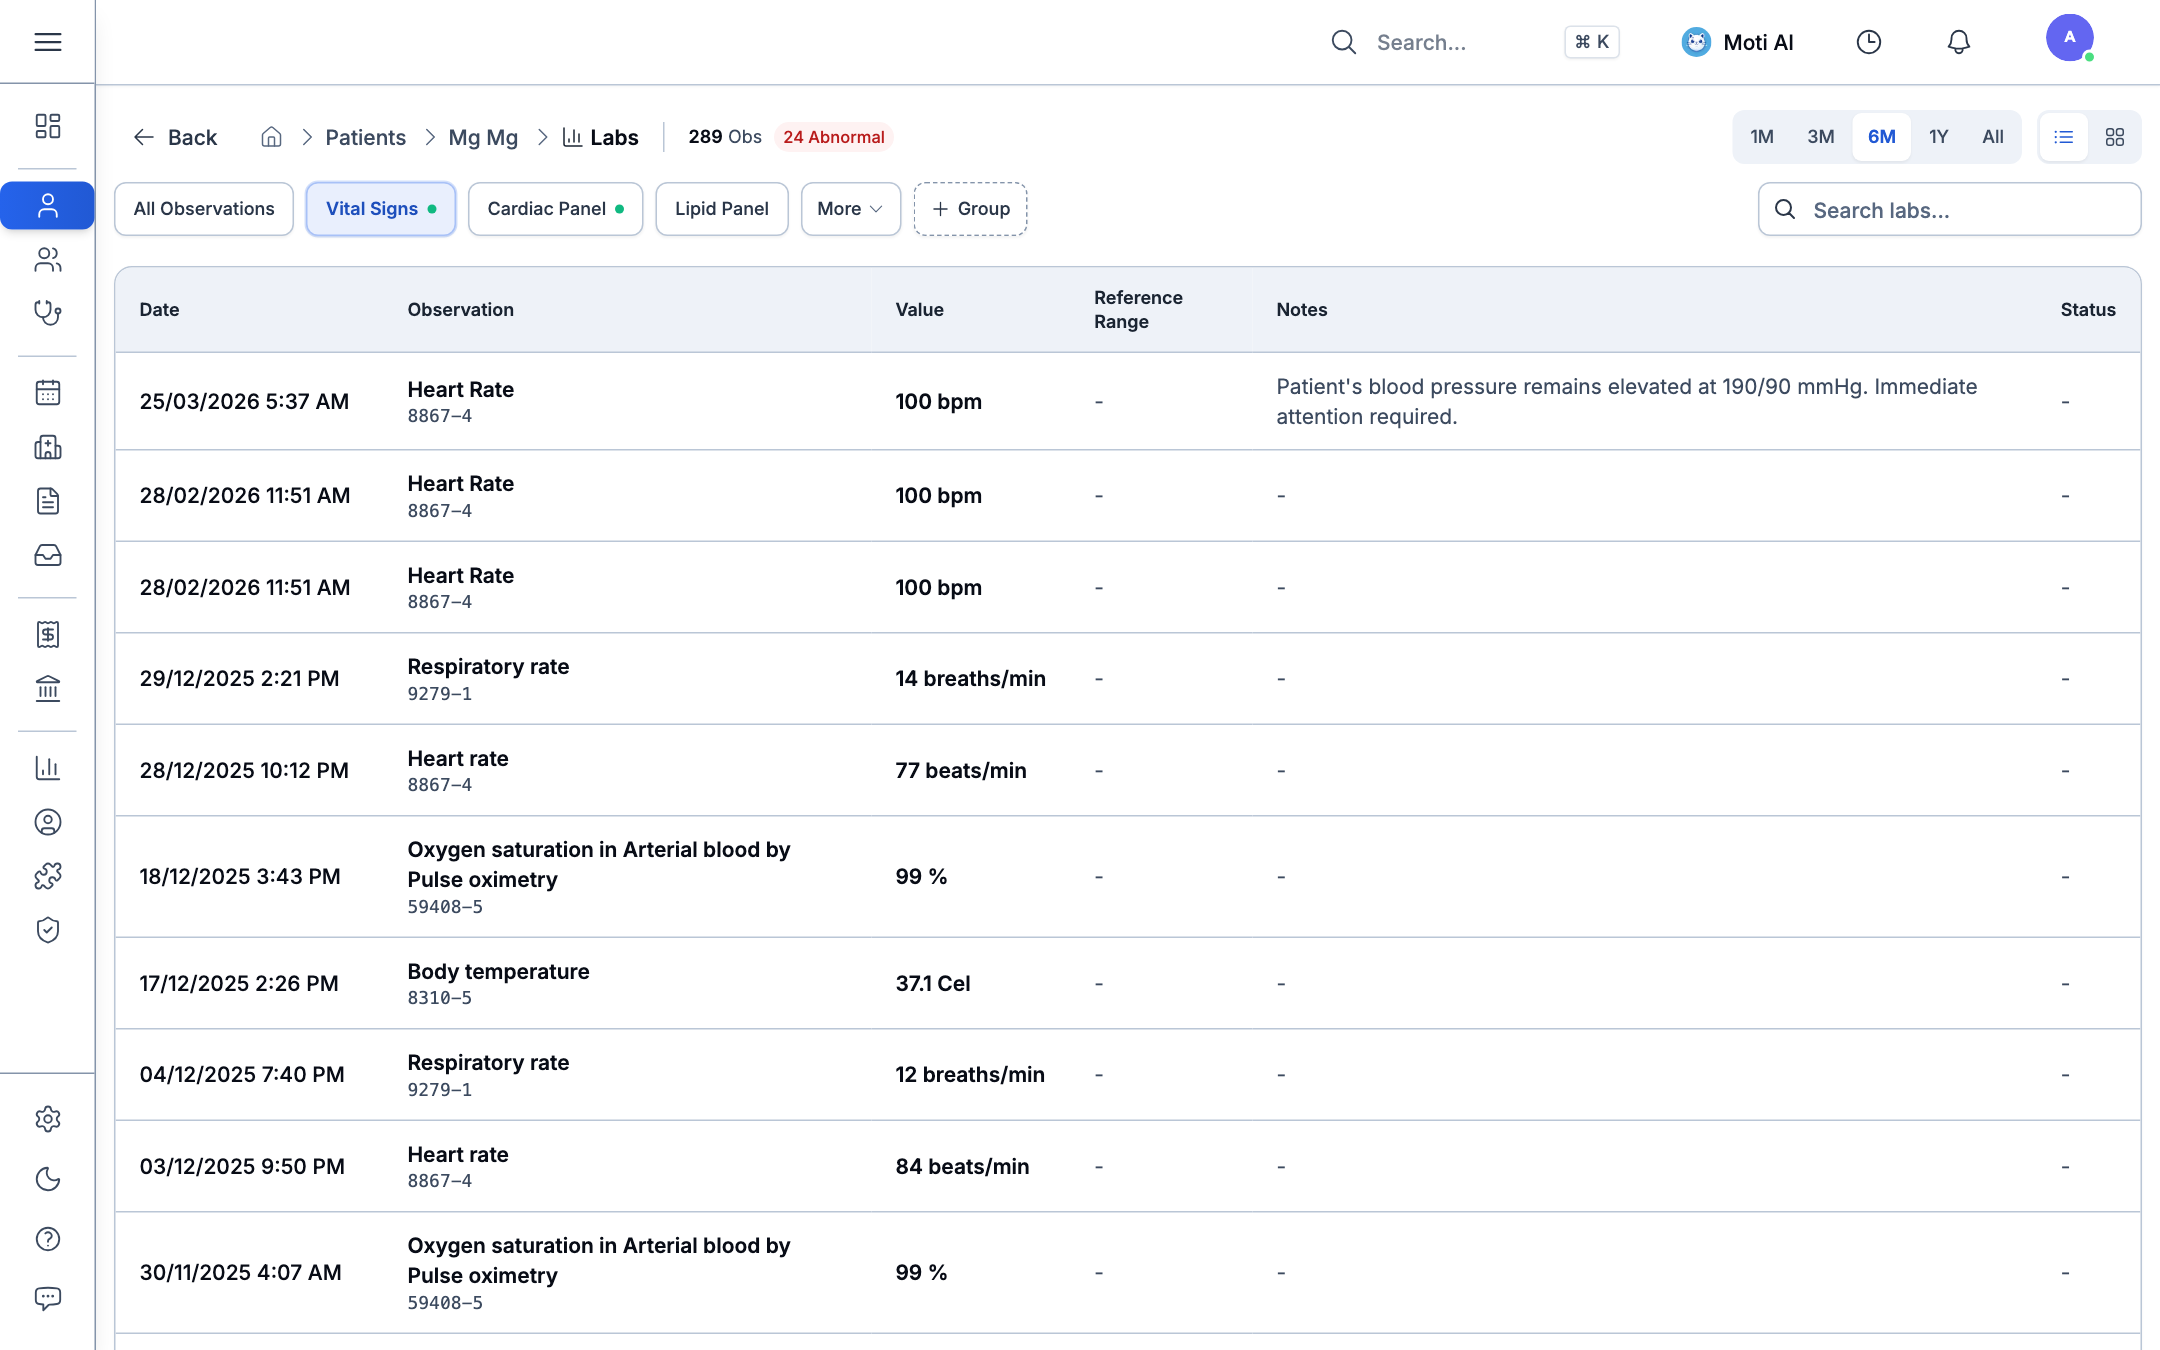
Clicking Vital Signs isolates core physiological metrics onto focused interactive line graphs:
1. Blood Pressure (Systolic & Diastolic)
- Tracks Systolic and Diastolic pressure (mmHg) over time.
- Standard clinical reference bands highlight optimal ranges (e.g., Systolic
< 120 mmHg, Diastolic< 80 mmHg), allowing doctors to immediately identify hypertensive spikes or hypotension trends. - Hover over any data point to inspect the exact recording date, time, and attending clinician notes.
2. Heart Rate & Pulse (bpm)
- Displays resting pulse rate variations over time.
- Helps monitor arrhythmias, response to beta-blockers, or athletic conditioning.
3. Body Temperature (°C / °F)
- Displays temperature trajectories during infection episodes, fevers, or post-operative monitoring.
4. Respiratory Rate & Oxygen Saturation (SpO2 %)
- Tracks respiratory health for asthma, COPD, and respiratory infection patients.
- Visual alerts indicate when oxygen saturation drops below safe thresholds (
< 95%).
5. Height, Weight & Body Mass Index (BMI)
- Automatically computes BMI (
kg/m²) whenever height and weight are entered during triage. - Graphical trend curves illustrate weight gain or weight loss trajectories over months of treatment.
Diagnostic & Laboratory Panels
Beyond bedside vitals, Medaius organizes diagnostic tests into standardized specialty panels:
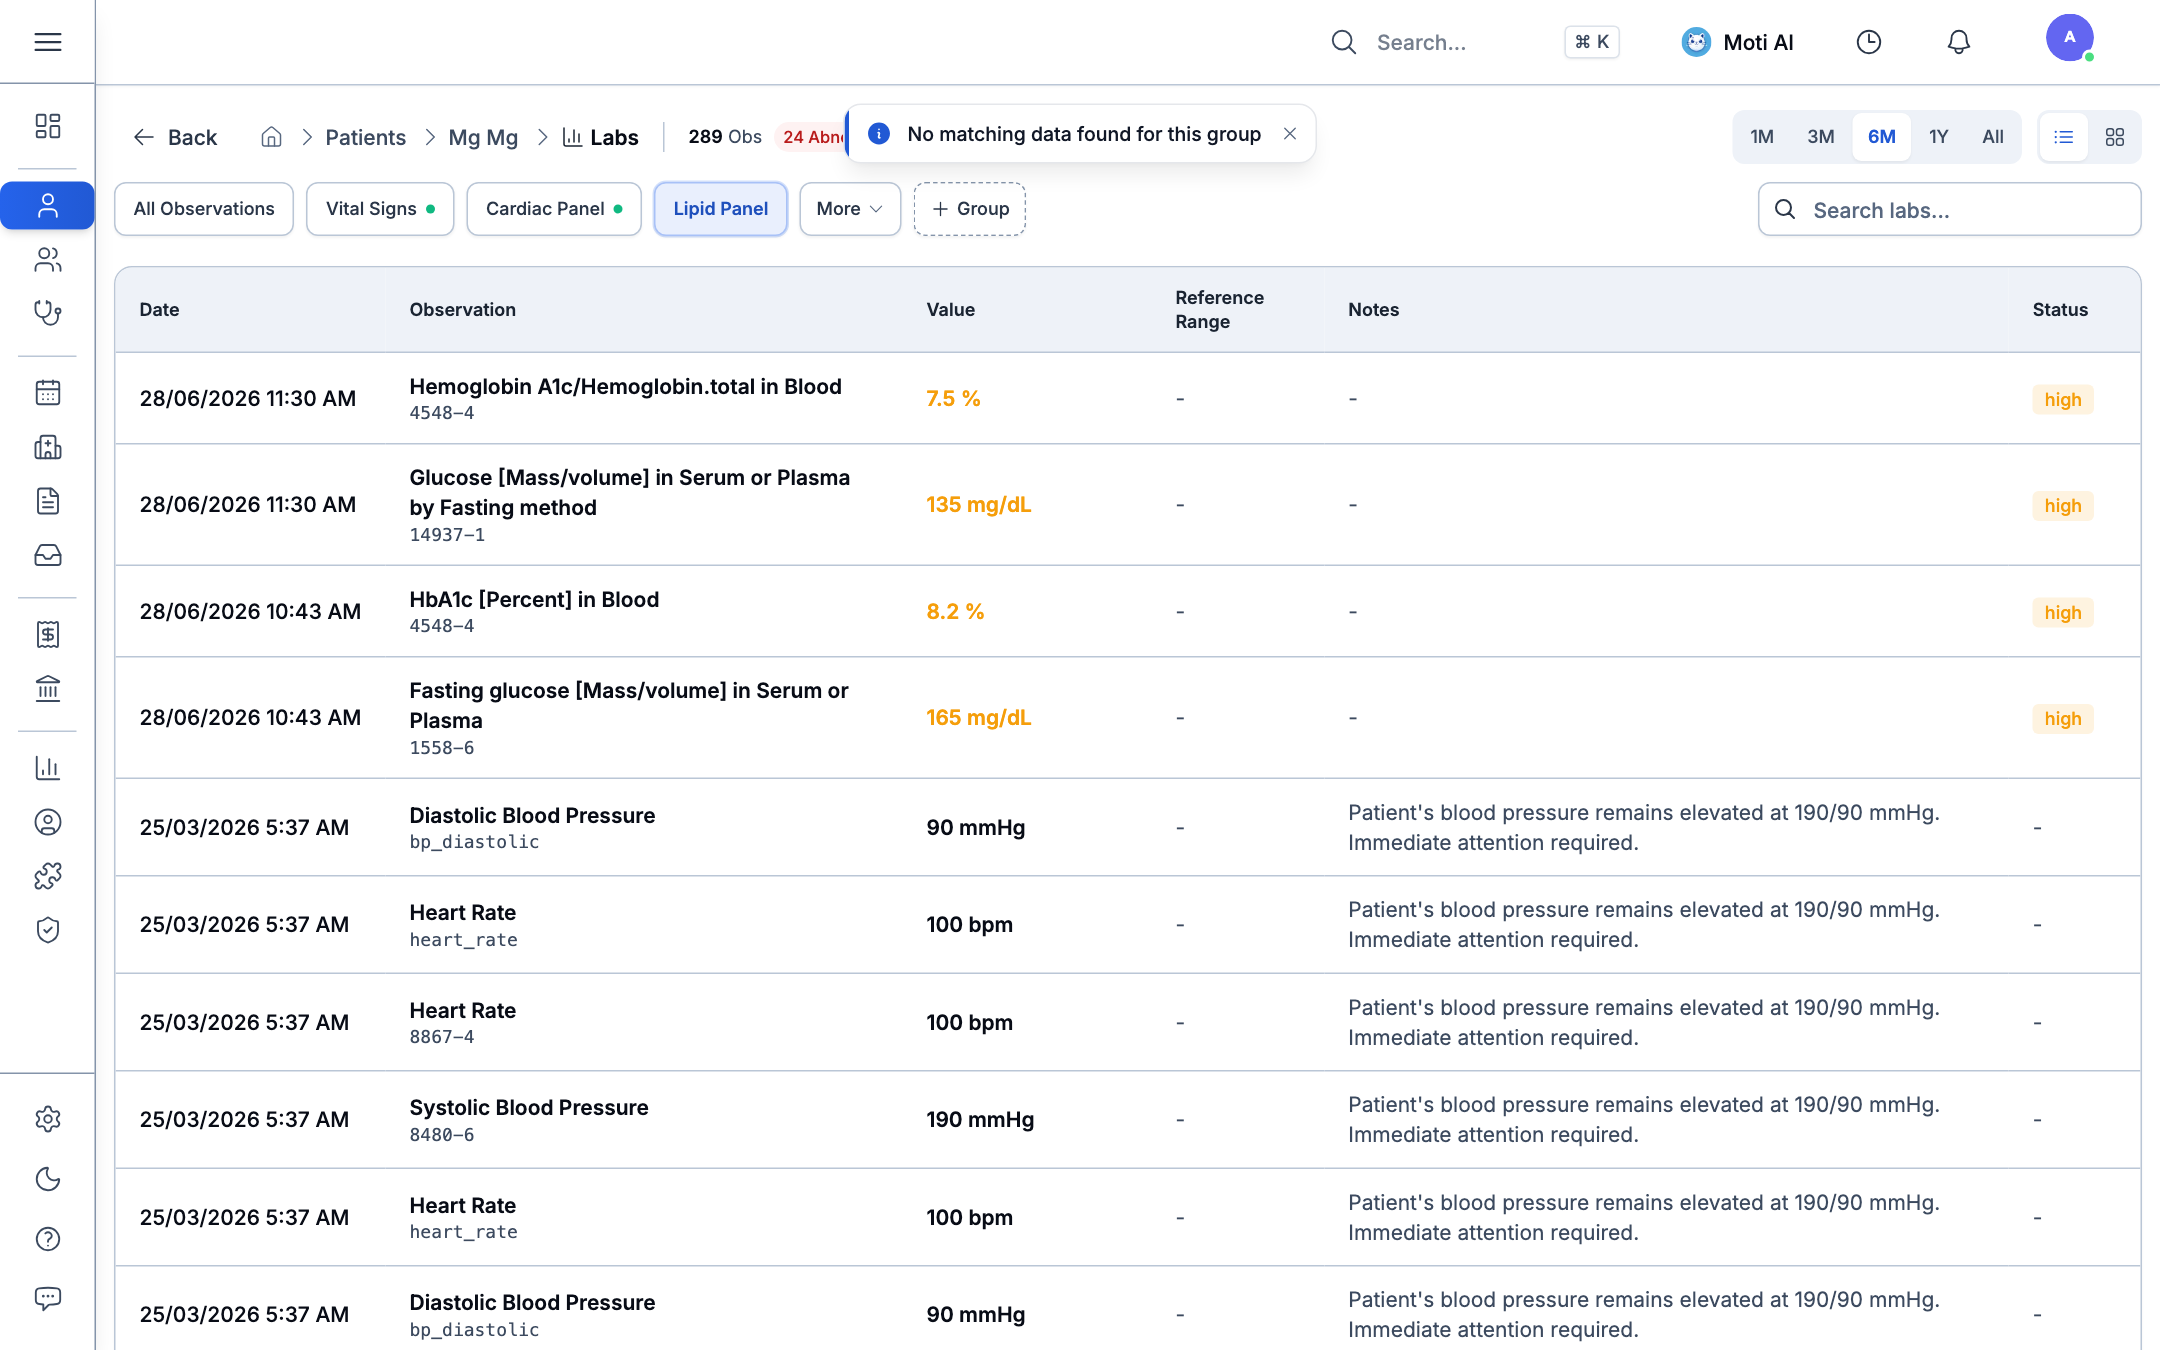
Supported Panels:
- Cardiac Panel: Troponin, CK-MB, and related cardiovascular biomarkers.
- Lipid Panel: Total Cholesterol, LDL ("bad" cholesterol), HDL ("good" cholesterol), and Triglycerides plotted against target cardiovascular risk thresholds.
- Metabolic Panel: Fasting Blood Glucose, HbA1c, and Serum Electrolytes (Sodium, Potassium, Chloride).
- Liver Function Panel (LFT): ALT, AST, Alkaline Phosphatase, and Total Bilirubin.
- Renal Function Panel: Serum Creatinine, Blood Urea Nitrogen (BUN), and estimated GFR (eGFR).
- Thyroid Panel: TSH, Free T3, and Free T4.
All Observations Overview
For a holistic multi-parameter view, select All Observations:
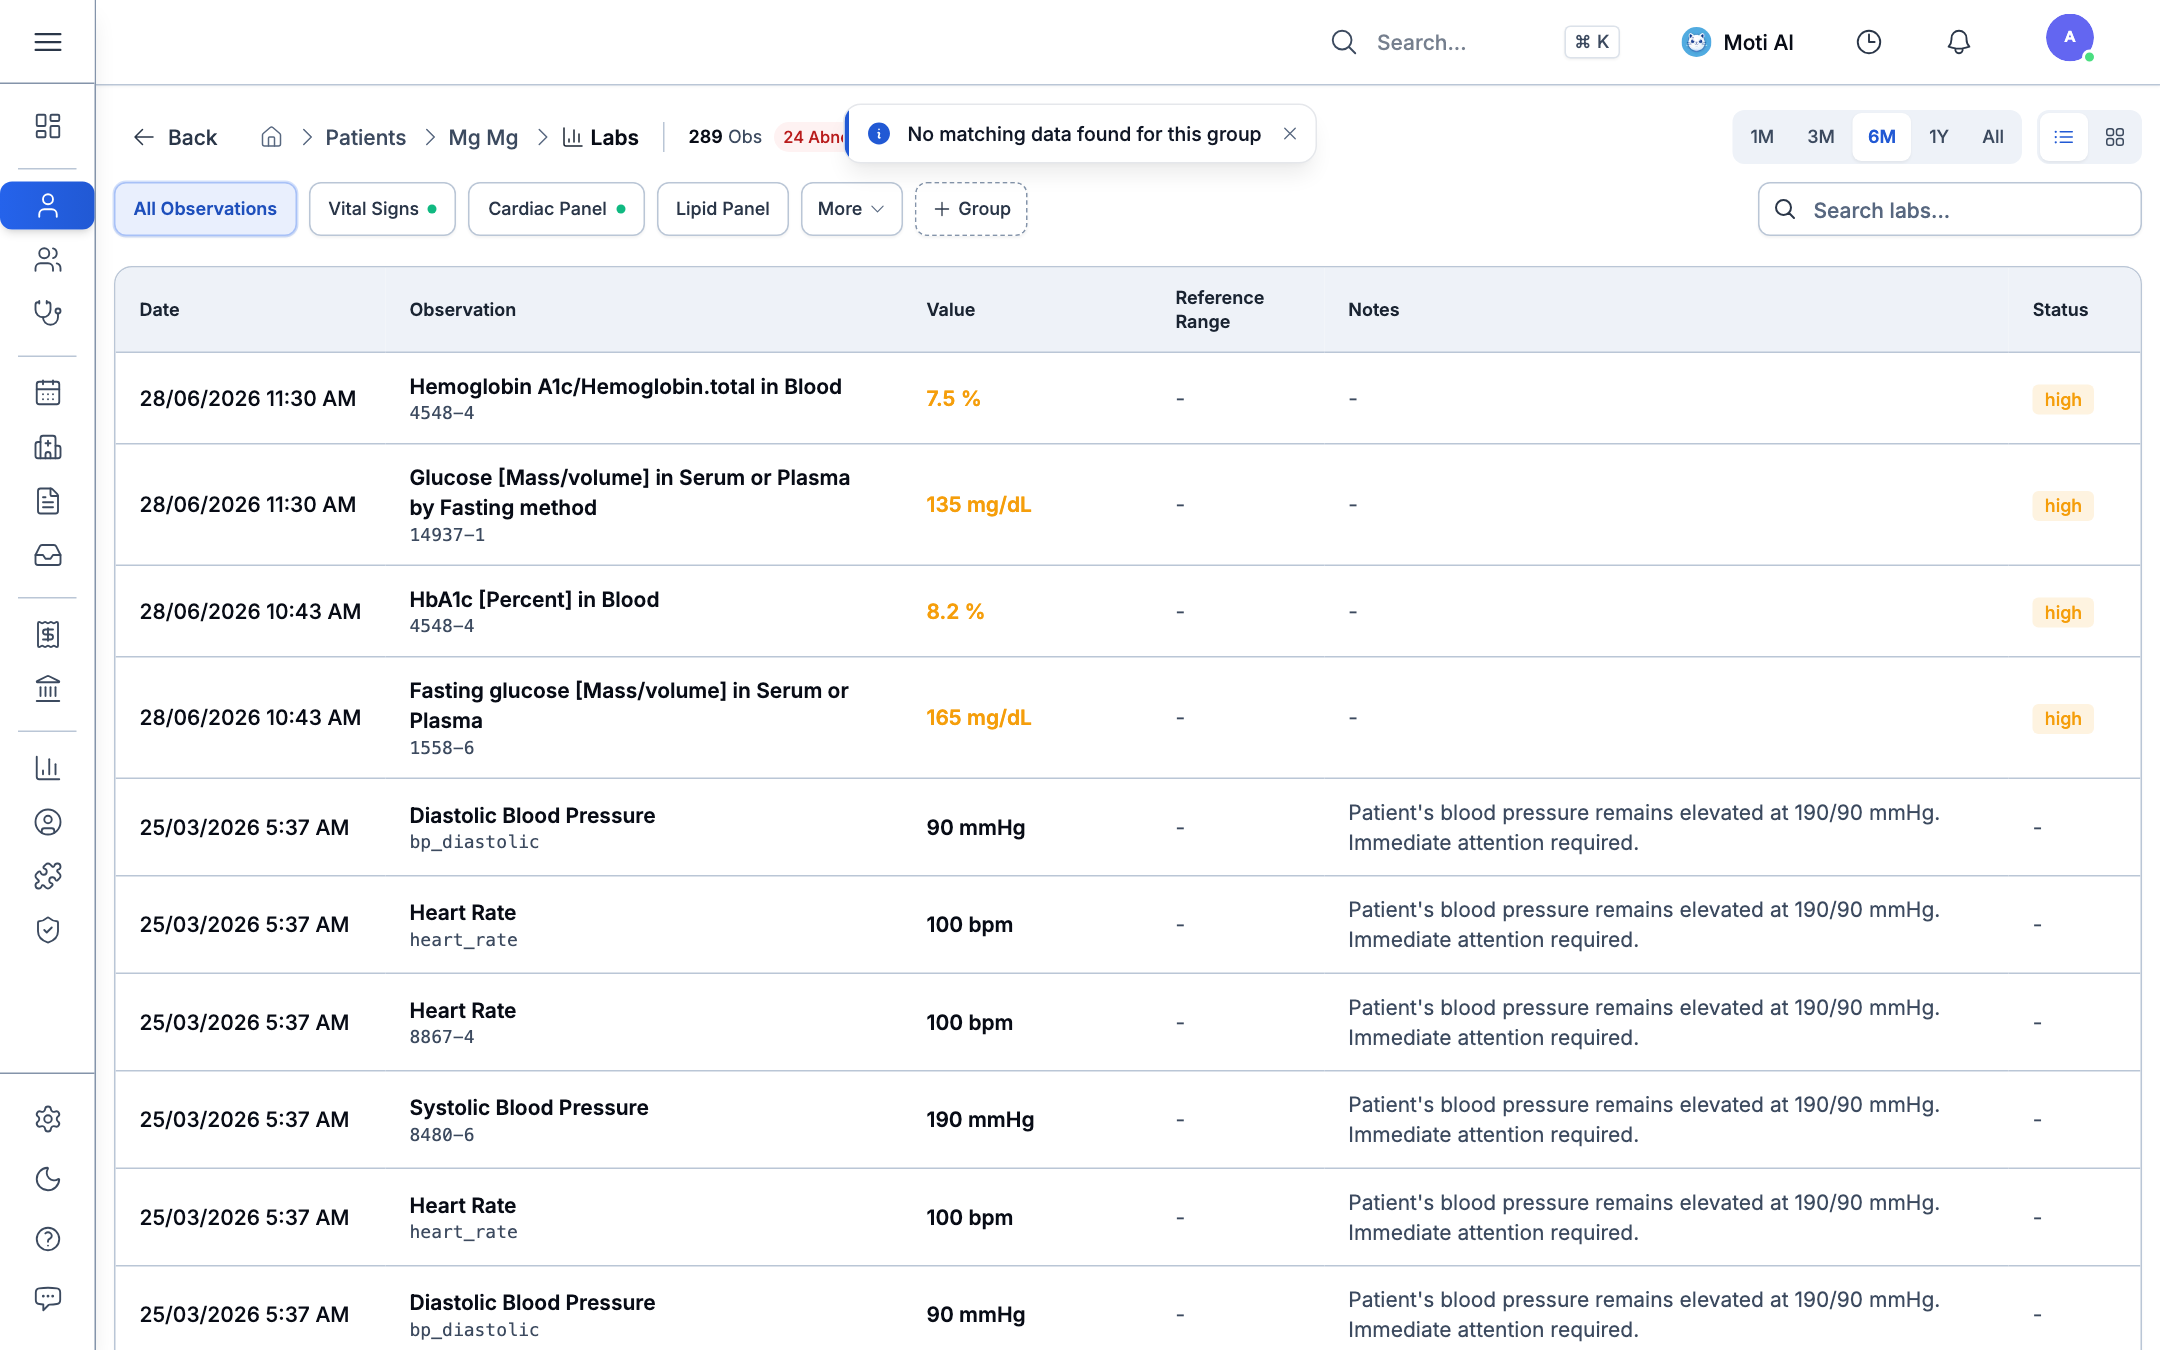
- Combines both physical measurements and lab values chronologically.
- Easily toggle individual metrics on and off to compare correlations (e.g., comparing Blood Pressure changes alongside Weight loss).
- Out-of-range values display distinct visual color chips to guide clinical assessment.
Clinical Benefits for Practice
- Immediate Trend Detection: Detect deteriorating health trends before symptoms become critical.
- Enhanced Patient Counseling: Show patients their visual progress graphs during consultations to encourage medication adherence and lifestyle changes.
- Referral Documentation: Export and print visual chart histories to accompany specialist referral letters.
Was this page helpful?
Help us improve our clinical documentation with your quick feedback.
Clinical Encounters & SOAP Notes
Start clinical visits, write SOAP notes, utilize keyboard slash commands, add clinical resources, sign off charts, and append addendums.
Inpatient, Wards & Bed Management
Manage hospital inpatient admissions, visualize live bed occupancy on the interactive Bed Board, configure ward departments, and coordinate patient transfers.