
Clinical Analytics & Custom Chart Builder
Monitor clinic performance, customize dashboards, and build custom analytical charts using the dynamic Query Builder.
Medaius includes an enterprise-grade Analytics & Reporting engine with an interactive Chart Builder Wizard. Practice administrators, clinical directors, and operations managers can analyze patient volume, demographic trends, and revenue trajectories without requiring data engineering assistance.
1. Practice Analytics Dashboard
Navigate to Analytics from the left navigation bar (/analytics):
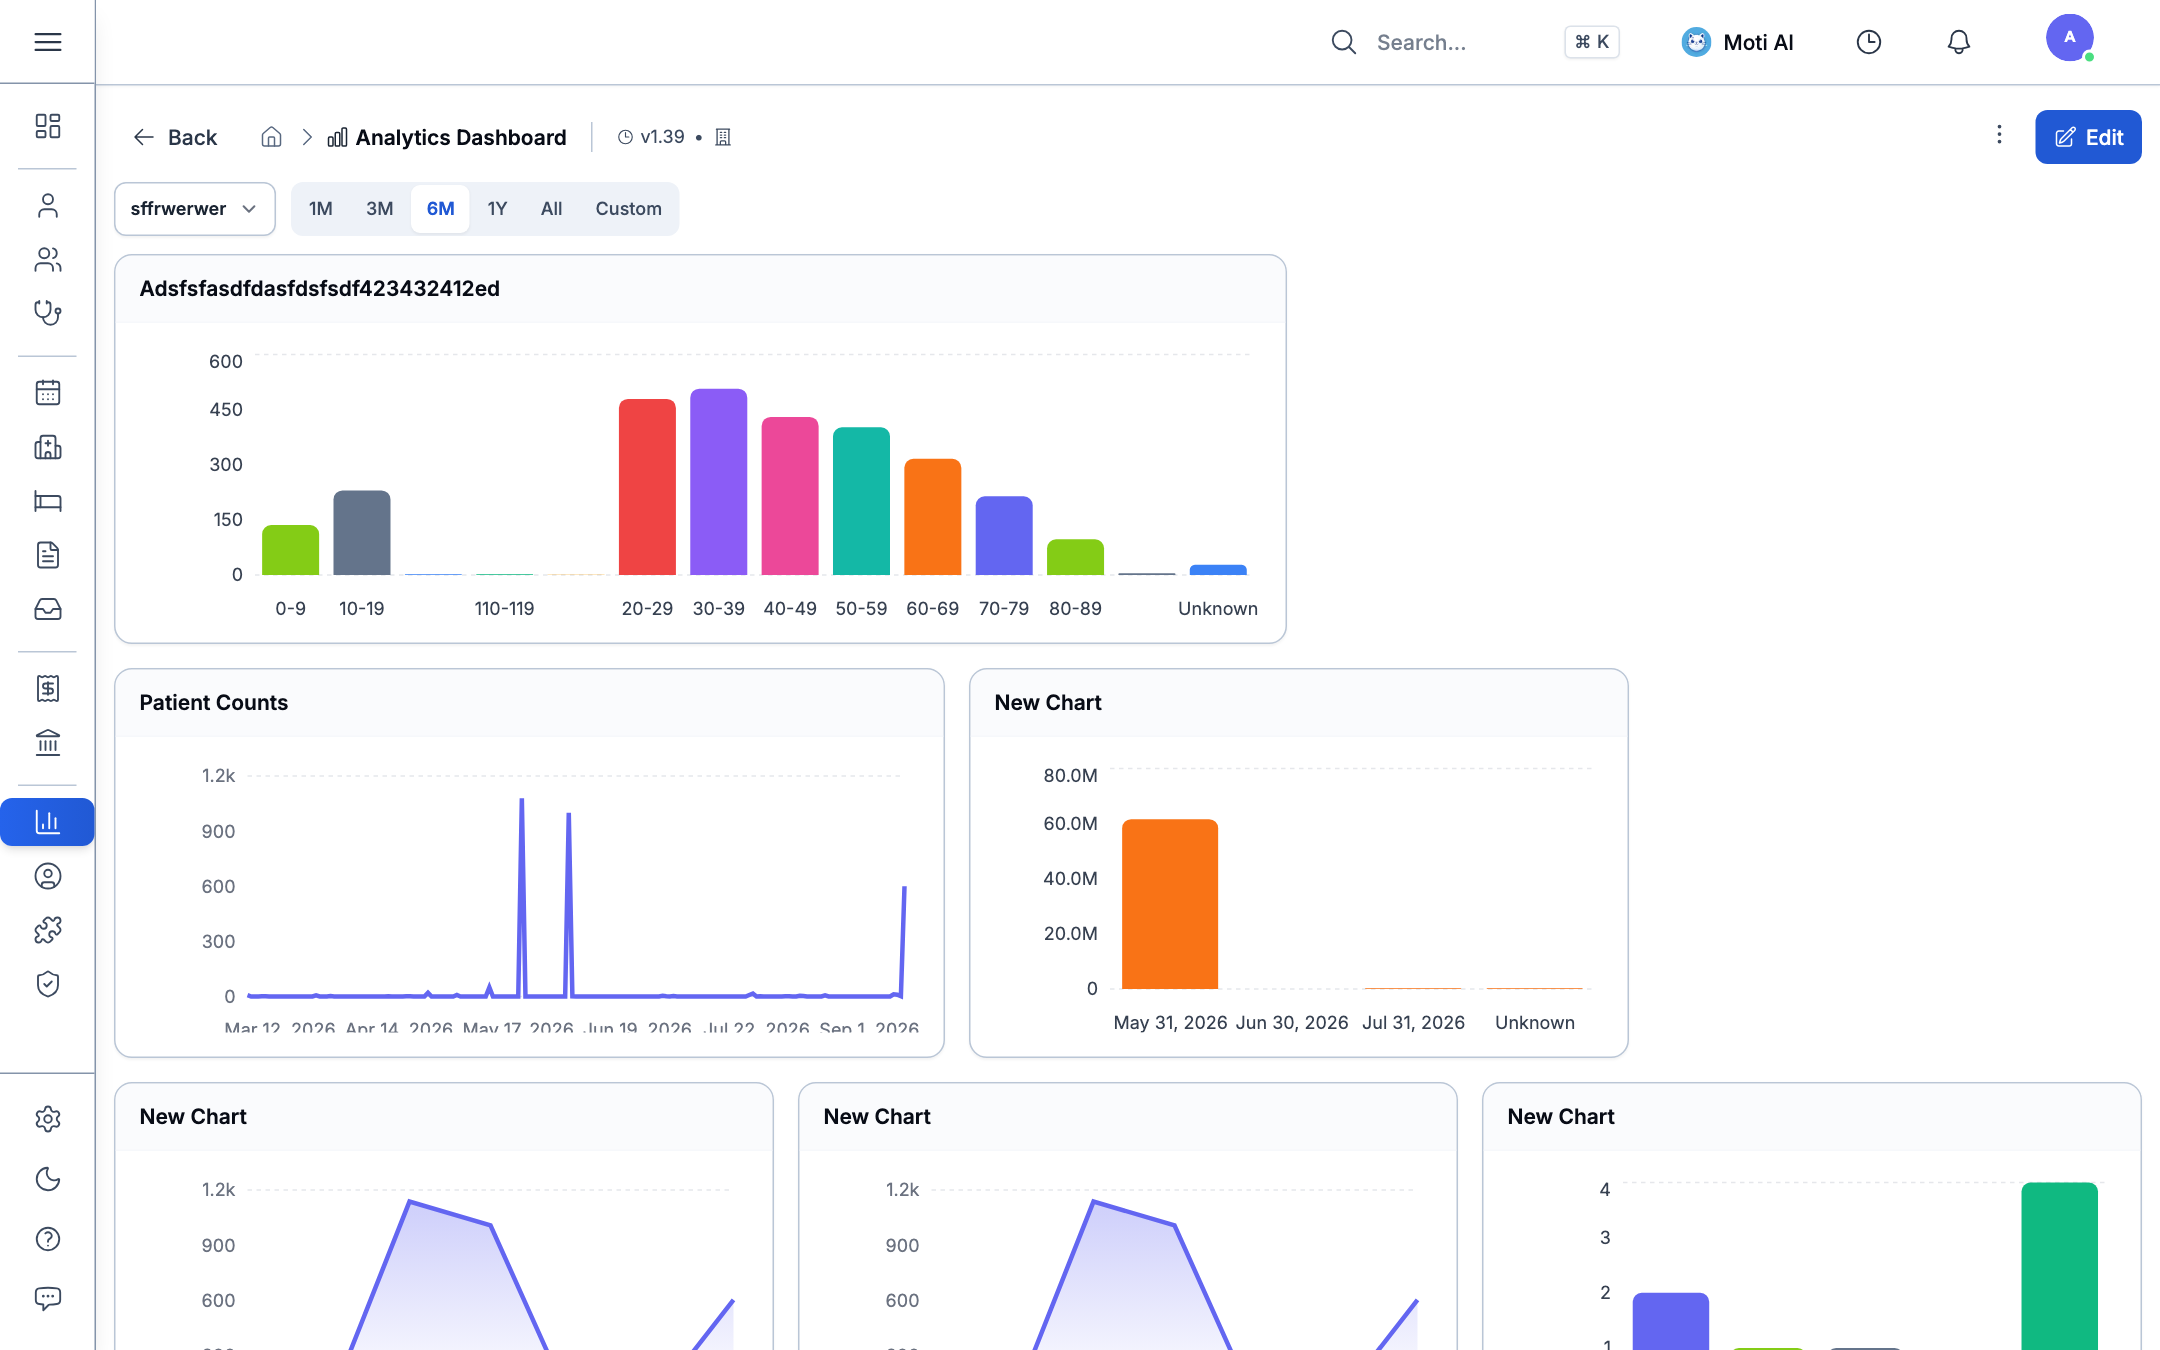
Key Dashboard Hubs:
- Demographic Distribution: Multi-color bar graphs displaying patient population across age brackets (0–9, 10–19, 20–29, 30–39, 40–49, 50–59, 60–69, 70–79, 80–89).
- Patient Counts & Visit Volume: Longitudinal trendlines tracking clinical encounter spikes, patient registrations, and daily volume.
- Revenue & Invoicing Trajectory: Real-time monetary tracking across completed visits, cash counter receipts, and outstanding invoice balances.
- Flexible Reporting Intervals: Instant filtering across preset ranges: 1M (last 30 days), 3M (quarter), 6M (semi-annual), 1Y (annual), and Custom date ranges.
2. Dashboard Customization & Edit Mode
Click the Edit button in the top toolbar to unlock interactive dashboard customization:
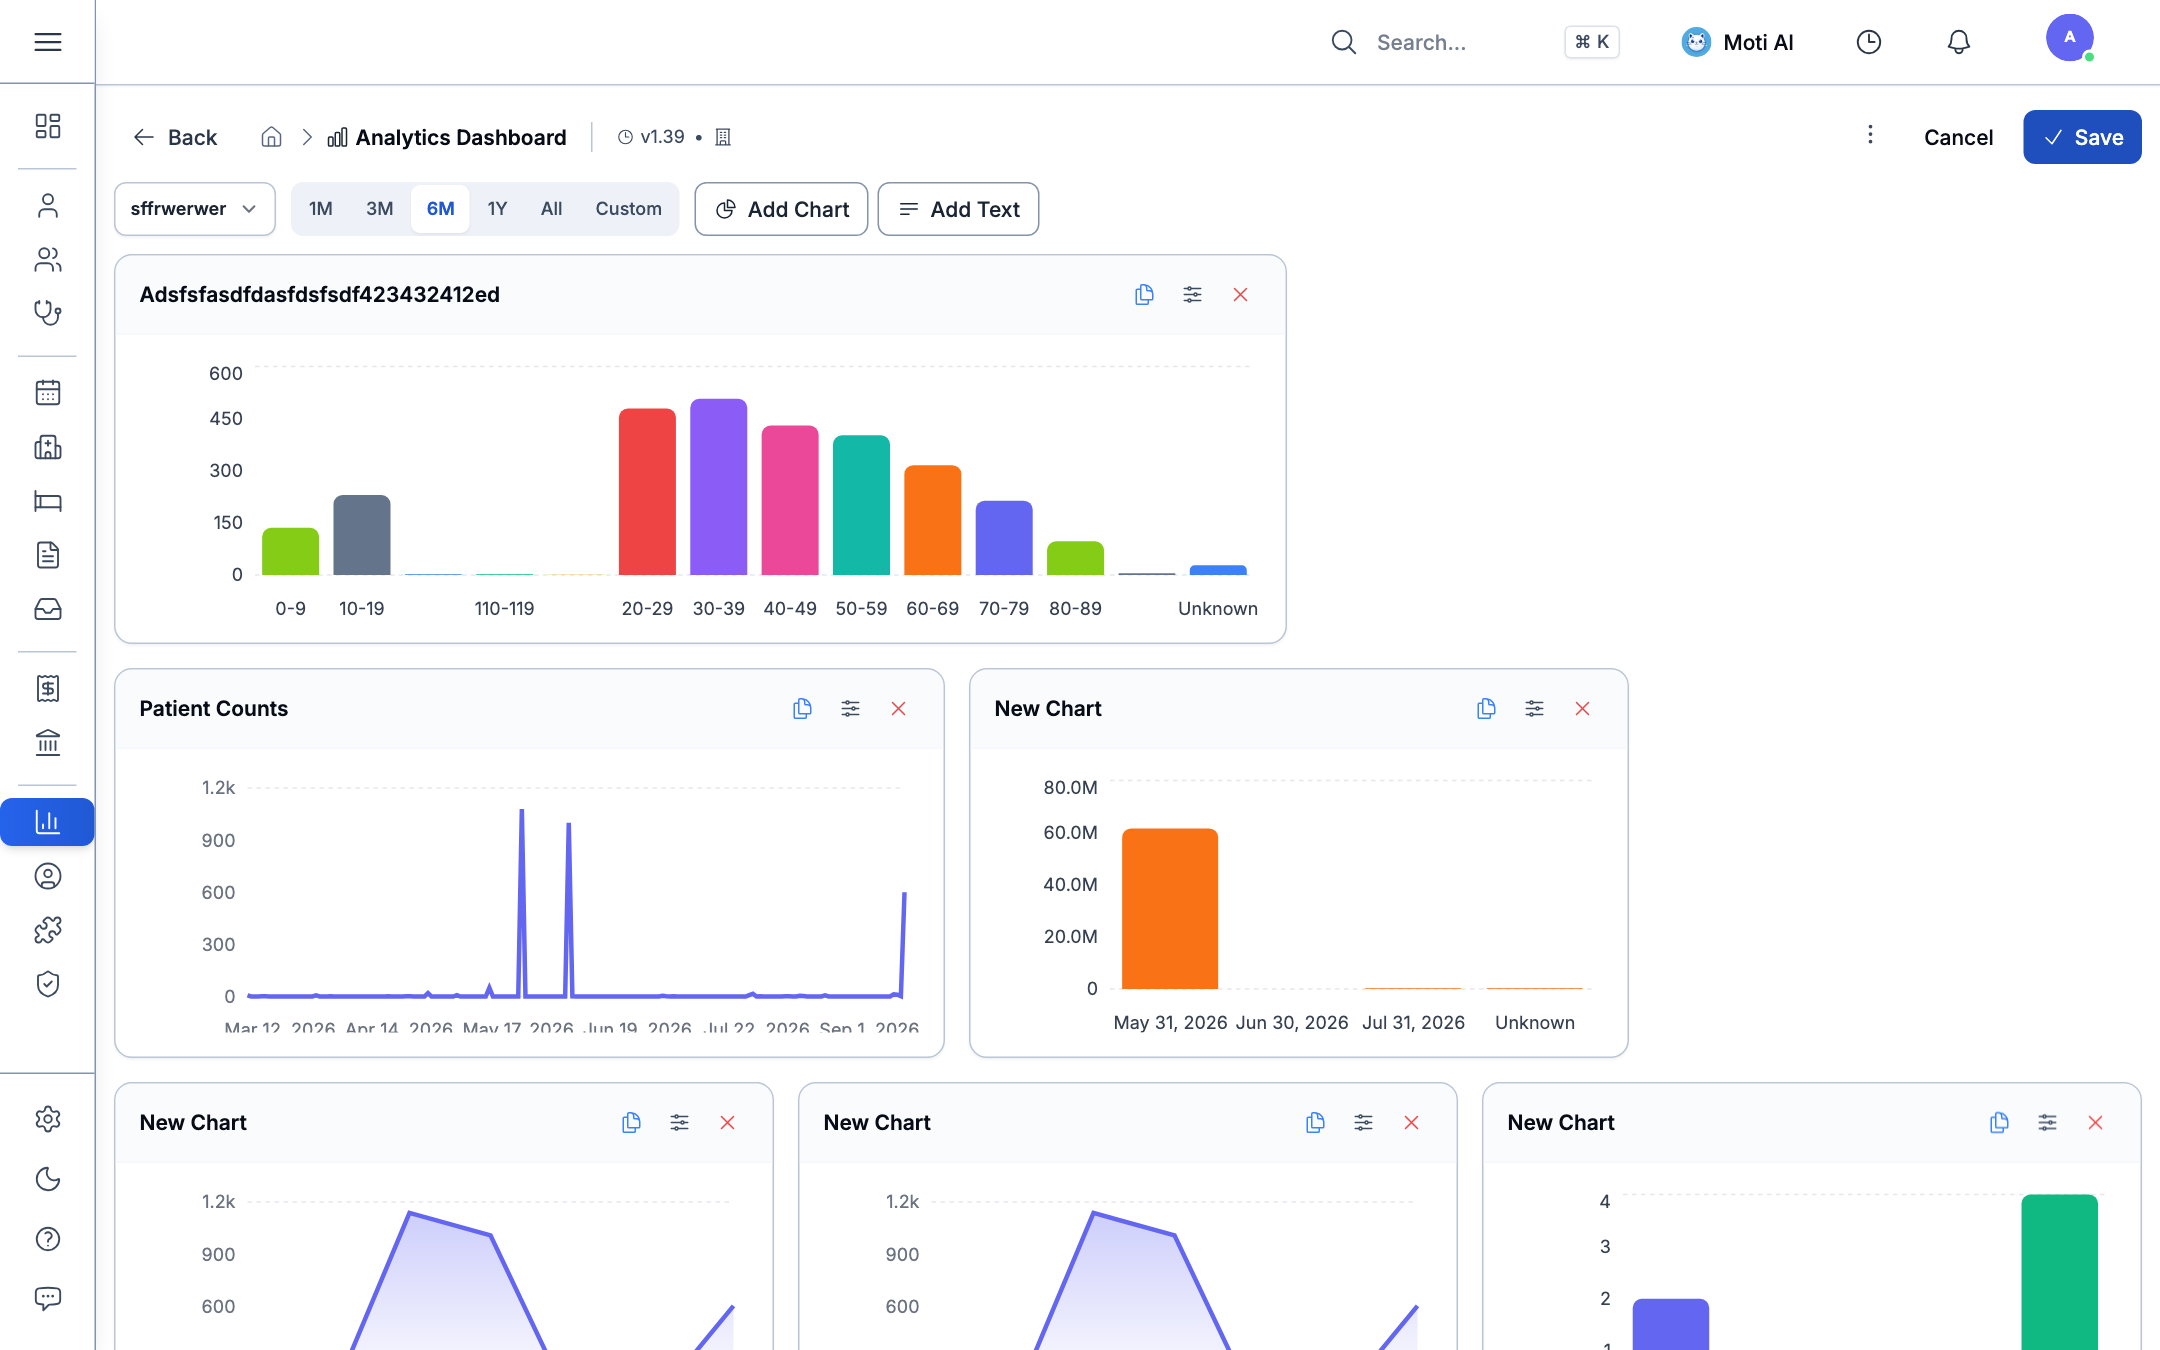
- Widget Actions: Duplicate, configure, or delete any chart tile directly from its header controls.
- Add Chart & Text: Click + Add Chart to launch the query builder or + Add Text to add operational notes and clinic announcements to the board.
- Save & Versioning: Medaius automatically versions dashboard layouts (
v1.39), allowing you to revert modifications anytime via version history.
3. Full-Screen Custom Chart Builder Wizard
Clicking + Add Chart or the configure icon on any widget opens the New Chart Builder:
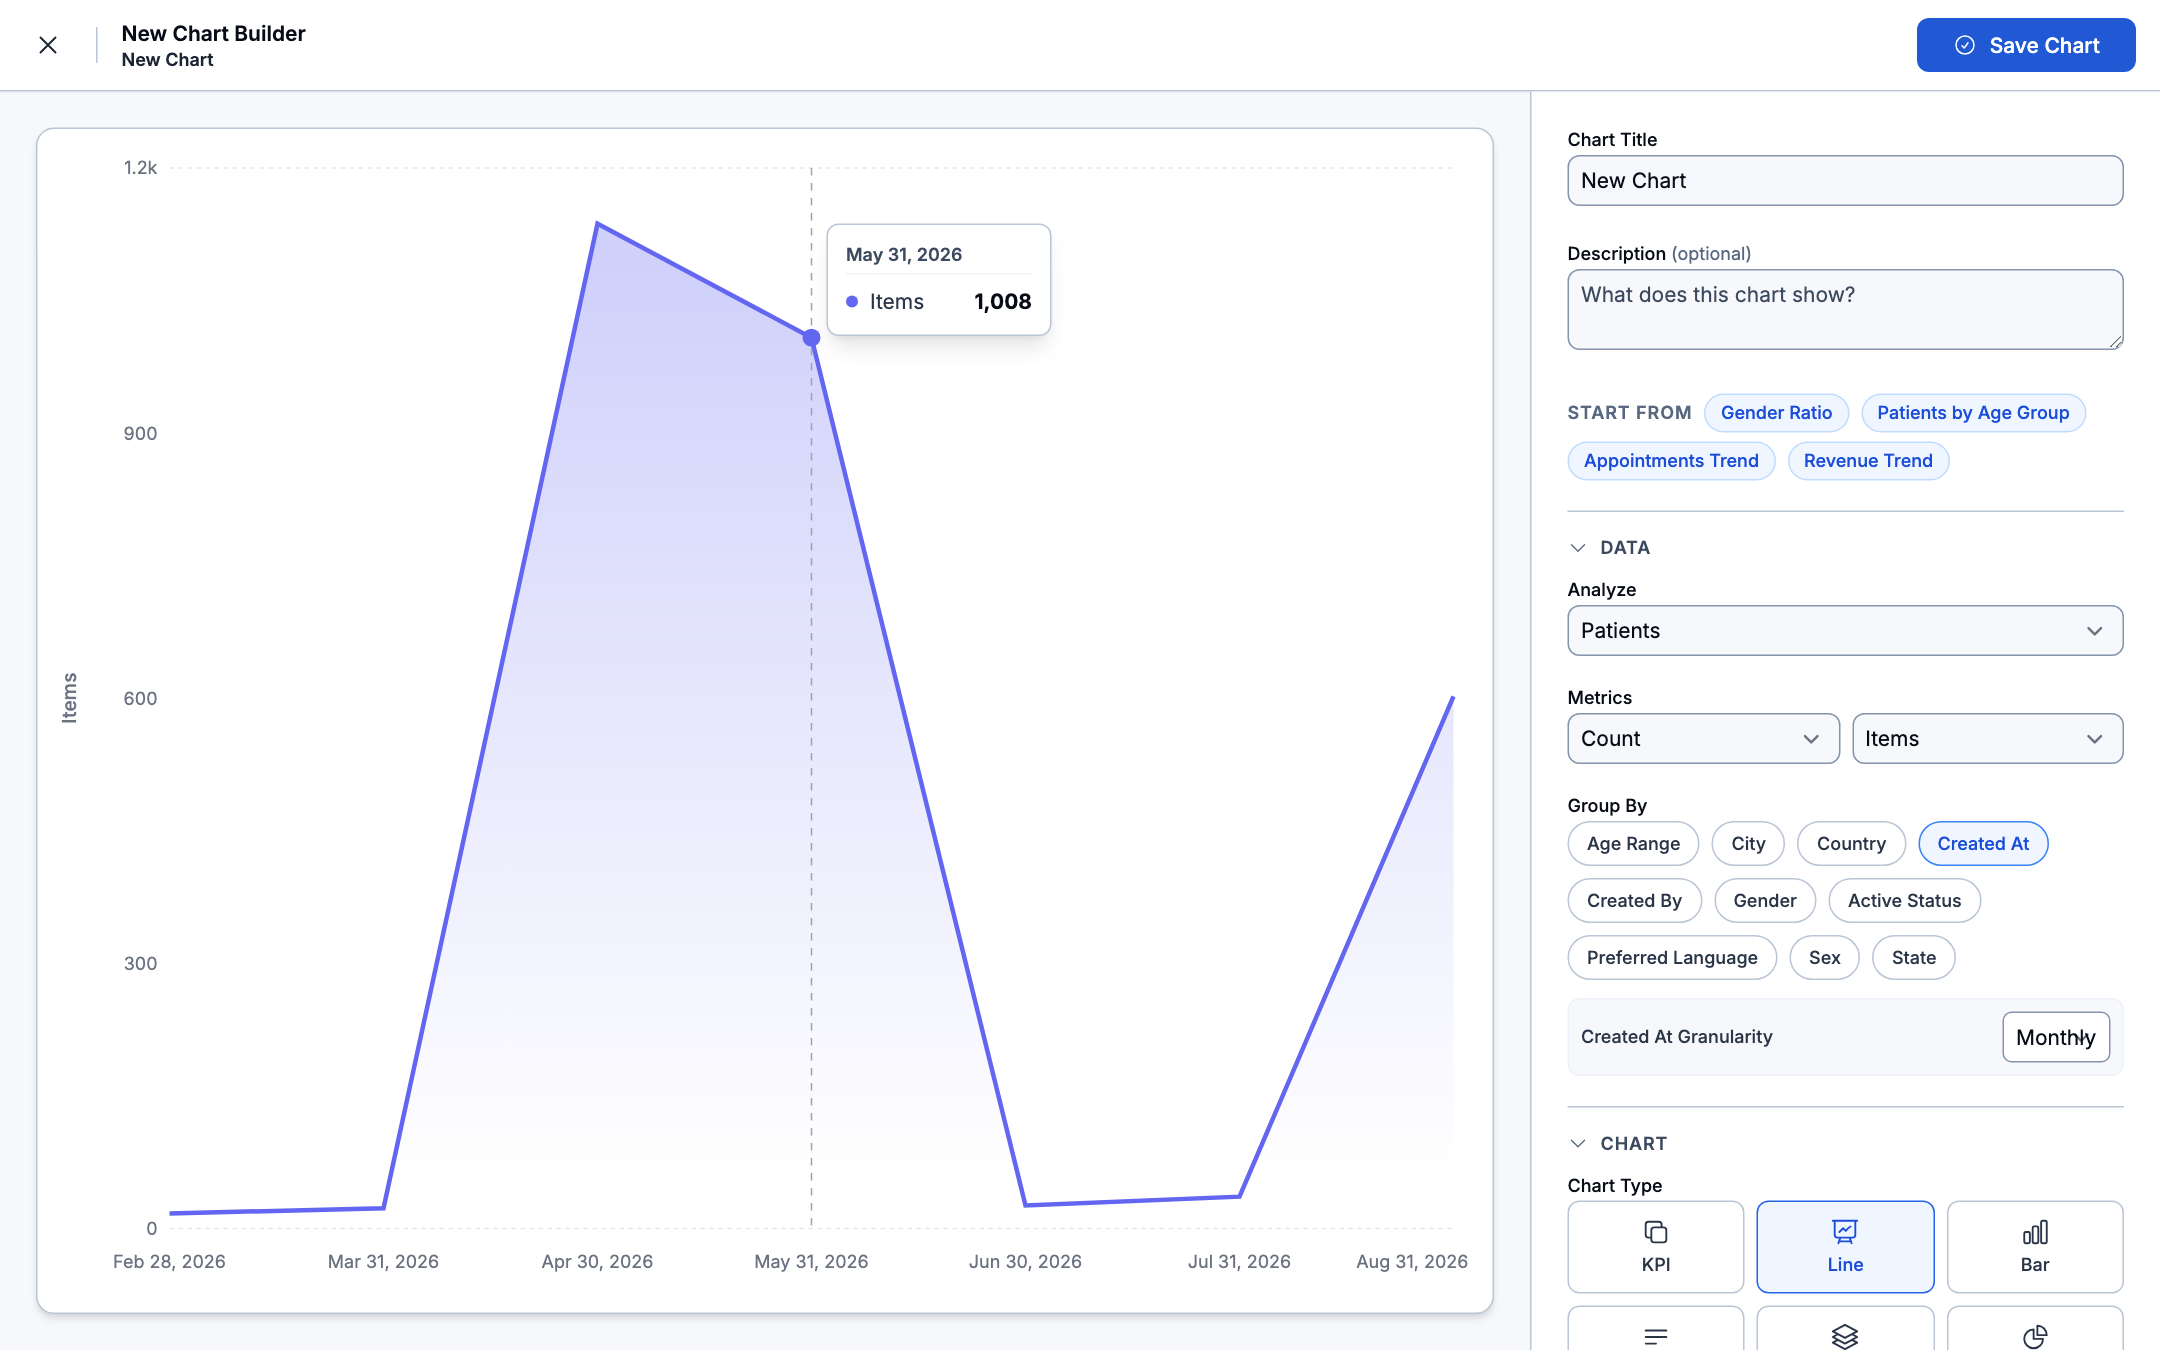
Building an Analytics Chart:
- Quick-Start Templates: One-click starting points for Gender Ratio, Patients by Age Group, Appointments Trend, and Revenue Trend.
- Data & Metrics Selection:
- Analyze: Select the core entity (Patients, Appointments, Encounters, Invoices).
- Metrics: Configure calculations (Count, Sum, Average).
- Multi-Dimensional Grouping: Group clinical data by Age Range, City, Country, Created At, Gender, Active Status, or Preferred Language.
- Time Granularity: Aggregate time-series records by Daily, Weekly, Monthly, or Yearly.
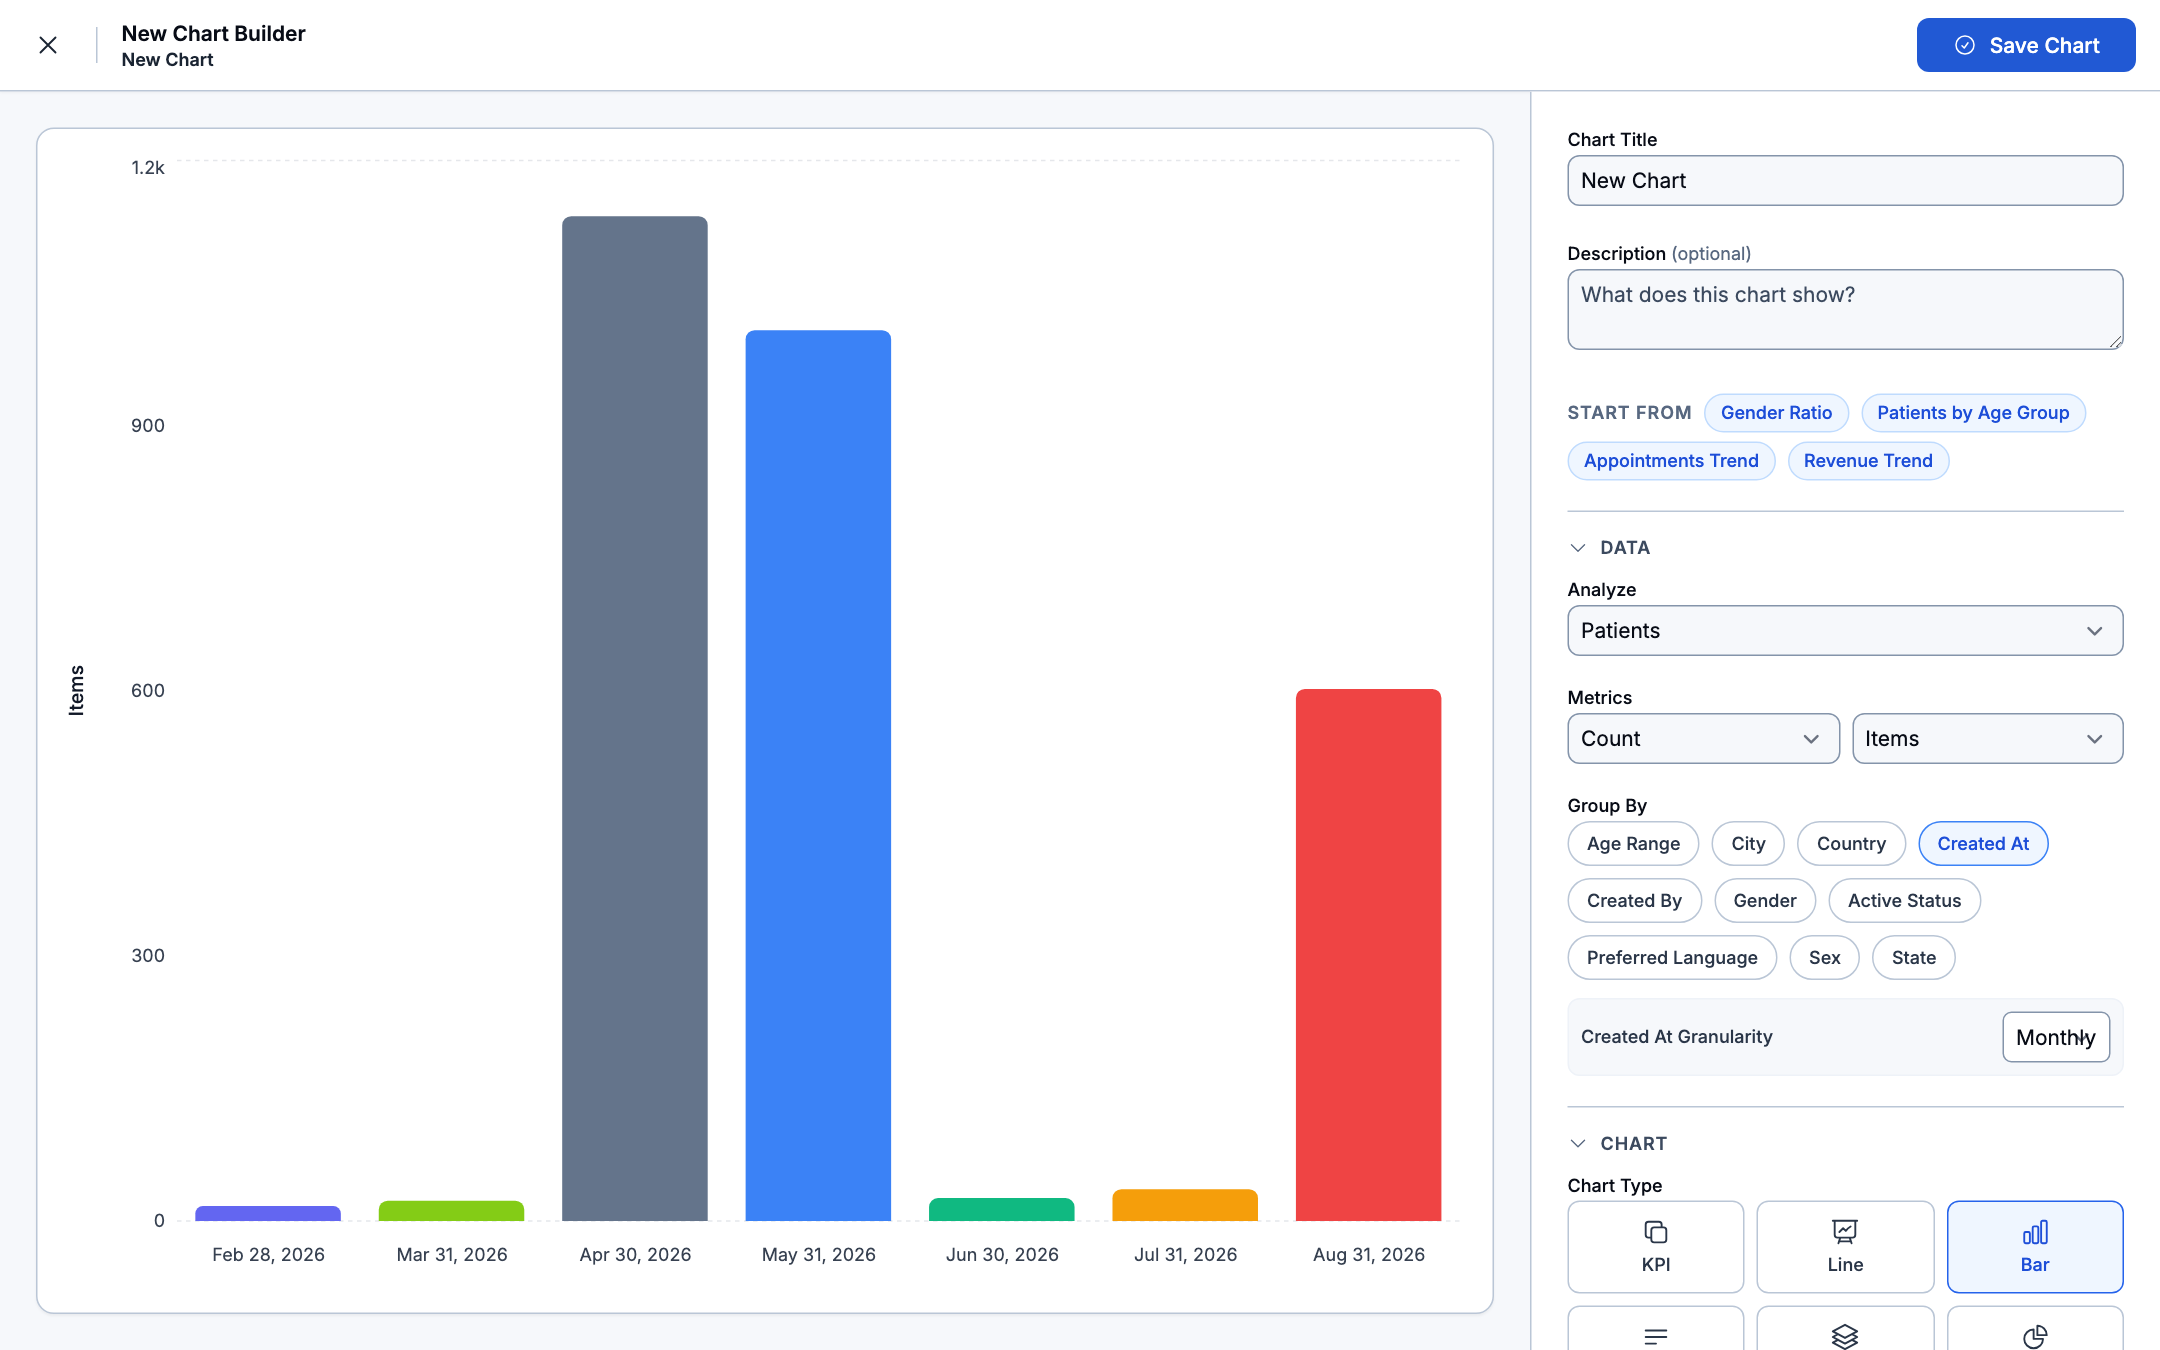
- Chart Visualizations: Switch between multiple visual styles:
- Line Chart: Continuous trendline curves with area gradient fills.
- Bar Chart: Categorical comparison columns.
- KPI Scorecard: Prominent single-number metric highlight cards.
- Pie & Donut Charts: Proportional distribution breakdowns.
Was this page helpful?
Help us improve our clinical documentation with your quick feedback.
Roles, Permissions & Access Control
Configure multi-tiered role levels (L1–L9), manage granular functional permissions via the Role Form Modal, restore role snapshots, and inspect RBAC audit trails.
Marketplace, Add-ons & Module Governance
Enable or disable modular clinical capabilities, manage subscription plan entitlements, and configure hospital extensions.